Press release -
More pump price rises take petrol to highest in three years
Motorists begin 2018 paying the highest price for petrol since the end of 2014, RAC Fuel Watch data reveals.
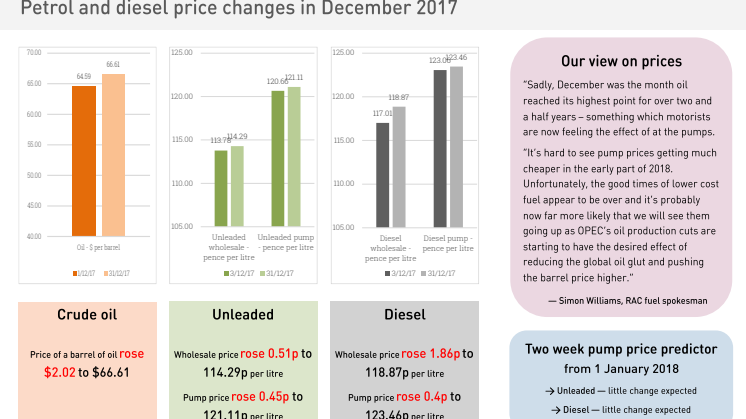
An analysis of fuel prices for December shows the average price of unleaded increased for the second month running – this time by half a pence from 120.66p to 121.11p (0.45p) while diesel went up from 123.06p to 123.46p (0.4p). A litre of petrol is now at its highest point since 2nd December 2014.*
Both fuels have increased substantially from July when petrol was at its cheapest point of the year at 114.33p a litre (up 6.8p) and diesel was 115.02p (up 8.4p). This means a tank of unleaded for an average 55-litre family car now costs £66.61 – £3.73 more than it did in July. For diesel, a fill-up now stands at £67.90 – £4.64 more than in the summer.
The current higher pump prices are a far cry from early 2016 when both fuels averaged 102p a litre. But – more positively, they are still considerably cheaper than April 2012 when the UK average prices of petrol and diesel reached record highs of 142p and 148p a litre respectively.
Fuel price highs and lows
| Date | Key date description | Petrol - pence per litre | Diesel - pence per litre | £ v $ | Oil price | Petrol 55-litre tank | Diesel 55-litre tank |
| 28/12/2017 | 2017 end of year | 121.11 | 123.46 | $1.35 | $66.61 | £66.61 | £67.90 |
| 02/07/2017 | 2017 petrol & diesel low | 114.33 | 115.02 | $1.29 | $48.98 | £62.88 | £63.26 |
| 29/12/2016 | 2016 end of year | 117.23 | 119.63 | $1.23 | $54.86 | £64.48 | £65.80 |
| 02/03/2016 | 2016 petrol low | 101.65 | n/a | $1.40 | $36.41 | £55.91 | n/a |
| 14/02/2016 | 2016 diesel low | n/a | 100.78 | $1.44 | $32.69 | n/a | £55.43 |
| 13/05/2015 | Last time oil was above $66.61 | 116.20 | 120.51 | $1.57 | $66.69 | £63.91 | £66.28 |
| 30/12/2015 | 2015 end of year | 102.89 | 106.18 | $1.47 | $35.75 | £56.59 | £58.40 |
| 02/12/2014 | Last time petrol was 121p | 121.08 | n/a | $1.56 | $71.22 | £66.59 | n/a |
| 16/04/2012 | Petrol record high | 142.48 | n/a | $1.59 | $117.25 | £78.36 | n/a |
| 12/04/2012 | Diesel record high | n/a | 147.93 | $1.58 | $120.47 | n/a | £81.36 |
Fuel prices at the four big supermarkets went up by more than half a pence a litre in December with petrol rising from 117.26p to 117.84p and diesel from 119.69p to 120.34p. The price rises have been driven by the increased cost of oil which is now at its highest since May 2015 at $66.61 – the cost of a barrel rose 3% in December having started the month at $64.59.
RAC fuel spokesman Simon Williams said: “Sadly, December was the month oil reached its highest point for over two and a half years – something which motorists are now feeling the effect of at the pumps.
“On a brighter note, the shutdown of the North Sea Forties pipeline did not cause the price of oil to increase as many expected. It had been feared this would lead to petrol and diesel going up in the run-up to Christmas, but luckily for drivers global oil production was not negatively affected as a result.
“It’s hard to see pump prices getting much cheaper in the early part of 2018. Unfortunately, the good times of lower cost fuel appear to be over and it’s probably now far more likely that we will see them going up as OPEC’s oil production cuts are starting to have the desired effect of reducing the global oil glut and pushing the barrel price higher.”
Regional fuel price variation
The North East experienced the biggest increased in the price of unleaded with a litre rising nearly a penny from 120.06p to 120.92p. Northern Ireland finished 2017 with the cheapest petrol at 120.27p and the South East with the most expensive at 121.87p.
London suffered the greatest rise in the price of diesel as a result of a litre going up 0.94p to 124.15p. This was still cheaper than the average price in the South East of 124.29p – the highest in the UK. Northern Ireland once again had the cheapest diesel at the start and end of the month with the cost of a litre hardly increasing.
Regional average unleaded pump prices
| Unleaded | 03/12/2017 | 31/12/2017 | Change - ppl |
| UK average | 120.66 | 121.11 | 0.45 |
| North East | 120.06 | 120.92 | 0.86 |
| Scotland | 119.78 | 120.54 | 0.76 |
| East | 120.79 | 121.34 | 0.55 |
| Wales | 120.27 | 120.81 | 0.54 |
| East Midlands | 120.66 | 121.18 | 0.52 |
| South East | 121.37 | 121.87 | 0.50 |
| North West | 120.34 | 120.78 | 0.44 |
| London | 120.88 | 121.29 | 0.41 |
| West Midlands | 120.33 | 120.60 | 0.27 |
| Northern Ireland | 120.07 | 120.27 | 0.20 |
| South West | 121.02 | 121.21 | 0.19 |
| Yorkshire And The Humber | 120.42 | 120.33 | -0.09 |
| Diesel | 03/12/2017 | 31/12/2017 | Change - ppl |
| UK average | 123.06 | 123.46 | 0.40 |
| London | 123.21 | 124.15 | 0.94 |
| Wales | 122.72 | 123.27 | 0.55 |
| South East | 123.78 | 124.29 | 0.51 |
| South West | 123.31 | 123.73 | 0.42 |
| East | 123.53 | 123.94 | 0.41 |
| North East | 122.29 | 122.67 | 0.38 |
| West Midlands | 122.65 | 123.00 | 0.35 |
| East Midlands | 123.15 | 123.44 | 0.29 |
| North West | 122.93 | 123.21 | 0.28 |
| Northern Ireland | 121.69 | 121.95 | 0.26 |
| Yorkshire And The Humber | 122.88 | 122.95 | 0.07 |
| Scotland | 122.78 | 122.84 | 0.06 |
Related links
Topics
Categories
Notes to Editors
* Average fuel prices quoted in theRAC Fuel Watch November report are based on Experian Catalist data from 1 to 29 December 2017 (wholesale prices) and 3 to 31 December 2017 (retail prices).